
Introduction and Background
This lab is to give the students a fun way to explore velocity using Hot Wheels. This lab can be done with young students simply by taking one time measurement and one distance measurement and calculating the average velocity. Or it can be more complex by taking several time measurements, graphing the data and, in addition to calculating the velocity, exploring the relationship between the slope on a time vs. distance graph and the velocity. I have used it in the latter capacity in my high school physics classroom and will present it that way. Prior to this lab I do a short review on slope and how to calculate it. In this lab I let, or lead, my students to discover that the slope of a time vs. distance graph is the velocity, however a slightly different approach could be to teach them this beforehand and then discuss the relationship between the velocity and the slopes on their graph. As far as things needed for the lab, I use 40 feet of Hot Wheels track, but any length could work. There are other timing methods that you might use depending on equipment that you may have, but for this lab we just use stopwatches. We also use Excel to graph and analyze our data.
The Lab
Purpose:
The purpose of this lab is to practice collecting data, calculate velocity, and explore the relationship of velocity and slope on a time vs. distance graph.
Procedure:
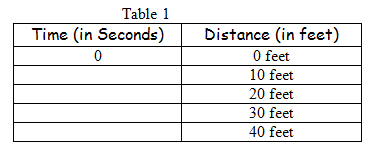
Lay out 40 feet of Hot Wheels track. Have someone positioned at 10, 20, 30 and 40 feet along the track with stop watches. Send your car down the track. Do not push it. Just let go and let gravity do the work. Everybody will start their stopwatch as the car is released. As your car passes each person, they should stop their watch. Record the data.
Data:
Analysis:
- To calculate the average velocity, take the distance traveled and divide by the time (v = d/t). Calculate the average velocity of your Hot Wheels car by dividing 40 feet by the time it took the car to go 40 feet. This is your velocity in feet per second.
- Calculate the time it took for the car to go each 10 foot interval. Record your results in the table below.

- Calculate the velocity for each 10 foot interval using the equation v = d/t

- Graph Table 1 using Excel. Time will be your x variable and distance will be your y variable. Make sure you use data labels to label the x and y coordinates of each point. Print out your graph.

- Using your graph, calculate the slope between each point. Slope = (y2-y1)/(x2-x1)

- Compare the velocities in table 3 with the slopes in table 4. How are they related?
- Convert the average velocity from analysis problem 1 and your fastest velocity from table 3 into miles per hour.
Summarize the lab as well as discuss the relationship between time, distance, velocity, and slope, as well as the process of how we discovered that relationship.
Notes
- When I set up the track, I find a slope to put it on and then try to vary the steepness using boxes boards, etc.

- The accuracy of the stopwatches is questionable at best, but it is a cheap accessible method and since the success of this lab is not determined by the accuracy of the velocities, but by the ability to calculate the velocity and analyze the data it is a good method. If you don't have stopwatches, most phones and tablets have them. You can also find stopwatches online like this one.
- For this lab the way it is written, experience with Excel is important. If you do not have Excel or some other graphing program that the students are familiar with, they could actually just graph the data by hand with graph paper. It's really just a few points. The nice thing about the graph is that it visually represents the velocities. Once the students discover that the slope of the lines and the velocities are the same numerically, we then talk about how the steepness of the line visually relates to the velocity of the car. The steeper the line, the faster the car was going.
- If the students don't have the math background or ability to calculate the slope, then you don't have to have them do it. You can just have them graph the data and talk about how the steepness of the line relates to the velocity.
- The last question under the analysis has them do some conversions. This is something that we have previously covered in class and I want them to practice. The students also like finding this answer as they usually have no idea if the velocity they calculated in ft/s is "fast" or not. Another discussion that this question usually leads into is scale speed. While the velocities of the cars may not be too impressive in miles per hour, when you remember that a Hot Wheels car is 1/64 scale and calculate the scale speed, they velocity is pretty impressive.


No comments:
Post a Comment