Friday, January 29, 2016

Hot Wheels Fantasy Pick'em - Week 5

Here is the line-up for races in week 5 of the Hot Wheels Fantasy Pick'em game. You can join in at anytime, so even if you haven't picked in previous weeks, make your picks and have some fun.

The Cars


Turbine Time


'71 Dodge Challenger

Hot Wheels High


2015 Ford Mustang GT

The Match-ups


Turbine Time vs. '71 Dodge Challenger
Hot Wheels High vs. 2015 Ford Mustang GT

The picks


Results 


Team Standings can be found by clicking HERE . See who is racing and make your predictions for week 6 by clicking HERE.

A note about the Challenger.  As long as it stays off the edge it's a pretty decent car, but because the the wheels are so far in, the body can rub on the side causing the car to slow down...sometimes dramatically.


Thursday, January 28, 2016

Hot Wheels STEM Lesson Plan – Introduction

I teach high school physics and I use Hot Wheels all the time.  They lend themselves so well to the motion and energy concepts.  On one of the first few days of school I have a PowerPoint presentation that I go through with the students introducing physics and our use of Hot Wheels.  After the presentation, I bring out the cars and let the students "shop" for a car.  They get to pick out a car from my collection (to be returned at the end of the year) that will be theirs for the rest of the year to use in all our Hot Wheels labs.  I tell the students that they can bring in a car of their own if they want to replace the car they choose, but make all of them choose a car. (Many that say they are going to bring in a car of their own, never actually do, so that's why I make them all choose a car on the first day)

To keep track of the cars I have some small plastic containers that I ordered from HERE that I put the students names on using labels.


Here is the Power Point presentation that I use to introduce physics and Hot Wheels.  Anywhere I've use "physics" the word "science" would work just as well.


 In this first slide I introduce several of the concepts that we will be covering in class. In the next several slides I show them some video clips of some amazing Team Hot Wheels stunts.


Here is the video clip from this slide.


Here is the next slide.


Here is the video clip from this slide.


Here is the next slide.


Here is the video clip from this slide.


Here is the next slide.


Here is the video clip from this slide.  For me, the point of this clip is to help inspire and motivate my students.


The next slide has several quotes from the previous video clip.  We spend some time discussing some of them.  Depending on how much time you want to take, you could even have the students spend a few minutes picking one or two of the quotes and writing a response to them.


In addition to our Hot Wheels labs, we do several design projects.  In this slide I list several of the projects that we will be doing throughout the year.


Here is the next slide, tying in the first slide where I said what physics was.


With this next slide I explain that we will be using Hot Wheels to help us learn many of the concepts listed.  I explain how they are going to "shop" for a car and that it will be their car for the rest of the year.


At this point I bring the out the cars and the kids get to do a little car shopping.  I do tell them not to kick the tires though! :)


Hot Wheels STEM Lesson Plan - Measurement

Introduction and background

Early on in the year, I always spend a little bit of time discussing measurement including the metric system and giving the students the opportunity to do some measuring.  This is important since we will be taking measurements in labs throughout the year as well as using the metric system, which the students are usually  not that familiar with.  This lab allows the students to use some measuring instruments.  I also have them measure the cars using the metric system and have them do some simple metric conversions.  We discuss how that measuring a Hot Wheels car in meters would be silly and that millimeters or centimeters would be a better way to express it's dimensions.  However, if we are using any of these measurements for a calculation like say, velocity, we would want it to be in meters, since millimeters per second is not a common unit for velocity.  This is why being able to convert from one unit to another is important.  You could have them do as many conversions in this lab as you want, and even use English units as well, but I just have them convert between a few metric units.


The Lab


Purpose:
The purpose of the lab is to let the students practice using a ruler and a scale to measure the height, length, width, and weight of their Hot Wheels car.  They will take those measurements using a metric unit and then convert that to other common metric units.

Procedure:
 The lab sheet that I use looks something like this.

Hot Wheels Measurement Lab Sheet

Notes

  • I tell the students to measure the widest, highest and longest points on their cars.  If they had to fit it into a box, what is the smallest the box could be and still fit it in.
  • I do check their measurements and mark them wrong if they are off by more than 2 mm.  This can be time consuming because I need to know the measurements of all their cars, but I use some calipers to measure their cars and can do it very quickly.


Hot Wheels STEM Lesson Plan – Scientific Method

Introduction and background

After I have taught/reviewed the scientific method with my students, we do a lab using Hot Wheels cars to give them practice using the scientific method.

The question they are trying to answer is: On which surface will my Hot Wheels car roll furthest after going down a ramp: 60 grit sandpaper, carpet, or cedar fencing?
You could do this lab with any number or type of surfaces that you choose.  Also, depending on the time you have and resources available you could let the students completely design the experiment, coming up with the surfaces and the set-up.  If this is the case, you could reword the question to: On which surface will my Hot Wheels car roll furthest after going down a ramp.

For our lab, due to time constraints, I have designed the initial set-up of the lab and the surfaces for the cars.


The Lab

The purpose of the lab is: To show understanding of the scientific method by designing a lab sheet (and possibly the lab itself), completing the experiment, then analyzing the data and reporting on the lab.

After showing the students the initial set-up, I have the students use a word processor to design a lab sheet that includes the following headings:
  • Problem/Question
  • Hypothesis
  • Independent and Dependent Variables
  • Constants
  • Procedure
  • Data
  • Analysis
  • Conclusion
The students need to have information under each heading through the Procedure as well as a data table that they can fill out during the experiment done and printed out before I will let them proceed with the experiment.  An example may look like this.
 

Hot Wheels Scientific Method Lab

Problem/Question
On which surface will my Hot Wheels car roll furthest after going down a ramp: 60 grit sandpaper, carpet, or cedar fencing?

 Hypothesis
My hypothesis is that the Hot Wheels car will roll the furthest on the 60 grit sandpaper.
Independent and Dependent Variables
The independent variable in this experiment is the surfaces the car is traveling on.  The dependent variable is the distance the car goes.
Constants
Some things that need to remain constant are:
The car I use.
Where/how high the car starts on the ramp.
How I release the car.
How I measure the distance including to the front or back of the car and the units I use.

Procedure
Line the back of the car up with back edge of the track.  Without pushing the car, release it so that it rolls down the orange track.  Let it roll on the surface until it comes to a stop.  Measure from the end of the orange track to the back of the car and record the distance in centimeters.  Repeat 5 times for each surface.  Use the same car for each trial and each surface.
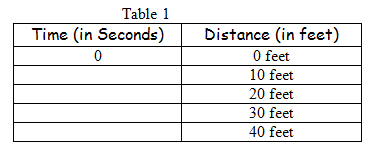
Data


Analysis


Conclusion


Once they have this much done and printed out, I let them start the experiment.  They should record the data on in their table.  When they have finished the experiment, it's back to the computer for them to do their analysis and write up their conclusion.  When the lab paper is finished I have them print it out and turn it in. 


Notes

  • Remember, this lab is not really about what surface the cars go further on.  The students are not graded on getting the "right" surface.  It's about the scientific method.  How well did they organize their lab sheet?  How well did they pay attention to the constants.  How well did they perform the procedure.  How well did they analyze the experiment and discuss the problems.  These are the things that I pay attention to and grade them on.  
  • The set-up I used is not perfect by design.  I like that there are problems with the set-up and hope that the students notice these and address them in their analysis and conclusion.  One of the potential problems is that on the wood and the sandpaper, sometimes the cars veer off the surface.  The most common ways the students try to deal with these are to just do more trials until they get their specified number on the surface; or they will put "railings" on the edge to keep the car on the surface. Hopefully they realize that rubbing on their "railing" will cause the car not to go as far and perhaps skew their results.  I usually don't talk to them about this, but do look to see if they discussed how their solution may have affected their data.  
    Using yard sticks to guide the cars
    Another issue with the experiment is that I've taped several pieces of sandpaper together.  Where they come together the seams aren't always smooth and sometime there are little ridges.  That could also affect their data.  Again, I don't talk to them about it.  I just watch to see if they notice.    There are a few other small possible problems with this set-up, but the key is, do the students notice, what if anything do they do to solve them, and most importantly, do they talk about them in their analysis and conclusion.  This is how they learn about experiments and what make a good one.   
  • Make sure that all the constants listed are addressed in the procedure.
  • I don't mention how many trials they should do.  I let them decided.  This let's me know how well they understand the scientific method and how important multiple trials are.  I always have a few who only do one trial.  Most do 2 or 3.  Once in a while I get students who will do 5 or more.

Hot Wheels STEM Lesson Plan – Acceleration

Introduction and Background

In this lab the students will be sending their Hot Wheels car down a straight slope and calculating it's acceleration.  Initially when I started having the students do this lab, I used a straight board, Hot Wheels track and some stopwatches.


However, recently I acquired a Dragtracks diecast race track and have turned this lab in to a fun race.  The Dragtracks system has two lanes, a start gate and finish line that declares the winner as well as gives the time.  The fact that it tells the time for the cars is the most important part as we need that to calculate the acceleration.  Since I have introduced the race component of this lab the students LOVE this lab.  The Dragtracks system costs a little over $100 for the Super Sport Edition, which is the one you need so that it separates out the reaction time and Elapsed times.  I ordered mine through JEGS with free shipping and JEGS has awesome customer service.  Again, you don't need the Dragtracks system, orange track and stopwatches will do, but the Dragtracks sure is fun!

Here's some video of the first round of our last race.


The Lab

Purpose: To calculate the acceleration of a Hot Wheels car as it races down the track.

Procedure: 
Your Hot Wheels car will participate in a double elimination contest. The track is 18.875 feet. Each race will be timed. Because it is a double elimination contest, your car will race at least twice, maybe more if it wins. Record the times in the data table below and then answer the questions to determine the acceleration of your car.

Data:
Analysis:
  •  Calculate the average time of your car using the data from however many races your car competed in.
    • Average time = ________________
  •  Calculate the average velocity of your car.  (v = d/t).
    • Average velocity = ______________
  •  Because the track has a consistent/constant slope, we will assume the acceleration is constant. The average velocity of any object that speeds up from rest at a constant acceleration is just half the final velocity.  So to find the instantaneous final velocity of the race, simply double the average velocity.
  • You now have an initial velocity (0) and a final velocity.  You also have the time it took the car to finish the race.  Calculate the average acceleration of the car for your races.
    • a = (change in velocity)/(change in time) = (Vf - Vi)/(elapsed time)
  • Your acceleration is in feet per second per second.  Convert your acceleration to miles per hour per second.
  •  Calculate the scale acceleration in miles per hour per second.  (Your Hot Wheels cars are 1/64 scale)
  •  Using the scale acceleration, how long would it take your car to go from 0 to 60 mph?

Conclusion:
Discuss the lab including it's set-up and procedure, as well as how you did in the race.  Also discuss the data you obtained and the results you found in your analysis. 

Notes

  • A bit of explaination of Table 1.  The way the Dragtracks system works is that once the green light is lit, each students pushes the pedal to release the car.  The total time is reported, including their reaction time.  The system also tell you the reaction time.  To calculate the acceleration, we just need to use the time it takes the car to get down the track, not including the reaction time, so the students need to subtract their reaction time from the total time to just get the time it took the car to travel down the track (The Elapsed Time) 
  • The Super Sport Edition of the Dragtracks race track will allow each individual to start their own car once the green light goes off, or has a mode where you can start both cars at the same time.  I like the mode where each individual starts their car, as it takes into account their reaction time and make the races more interesting, rather than the fastest car just winning all the time.  In this mode, anybody could have a chance at winning.
  • One important aspect to this lab is the constant slope.  I therefore modified the Dragtracks race track a bit by not using their normal hill to flat transition piece and then supporting the track as can be seen in the video.
  • A simpler version of this experiment could be done by using the Hot Wheels Speedometer. To find the acceleration you need the final velocity, so we use a distance and a time to get that; but the Hot Wheels Speedometer could be put at the end of the track and just give you the final velocity. The velocity that the Hot Wheels Speedometer gives is a scale velocity so that should be taken into account. To get the actual velocity you would divide it by 64 since Hot Wheels cars are 1/64 scale.


Hot Wheels STEM Lesson Plan – Velocity

Introduction and Background

This lab is to give the students a fun way to explore velocity using Hot Wheels.  This lab can be done with young students simply by taking one time measurement and one distance measurement and calculating the average velocity.  Or it can be more complex by taking several time measurements, graphing the data and, in addition to calculating the velocity, exploring the relationship between the slope on a time vs. distance graph and the velocity.  I have used it in the latter capacity in my high school physics classroom and will present it that way.  Prior to this lab I do a short review on slope and how to calculate it.  In this lab I let, or lead, my students to discover that the slope of a time vs. distance graph is the velocity, however a slightly different approach could be to teach them this beforehand and then discuss the relationship between the velocity and the slopes on their graph. As far as things needed for the lab, I use 40 feet of Hot Wheels track, but any length could work.  There are other timing methods that you might use depending on equipment that you may have, but for this lab we just use stopwatches.  We also use Excel to graph and analyze our data.  


The Lab


Purpose:
The purpose of this lab is to practice collecting data, calculate velocity, and explore the relationship of velocity and slope on a time vs. distance graph.

Procedure:
Lay out 40 feet of Hot Wheels track.  Have someone positioned at 10, 20, 30 and 40 feet along the track with stop watches. Send your car down the track. Do not push it. Just let go and let gravity do the work. Everybody will start their stopwatch as the car is released. As your car passes each person, they should stop their watch. Record the data.


 Data:

 Analysis:
  •  To calculate the average velocity, take the distance traveled and divide by the time (v = d/t). Calculate the average velocity of your Hot Wheels car by dividing 40 feet by the time it took the car to go 40 feet.  This is your velocity in feet per second.
  • Calculate the time it took for the car to go each 10 foot interval.  Record your results in the table below.
  • Calculate the velocity for each 10 foot interval using the equation v = d/t
  • Graph Table 1 using Excel.  Time will be your x variable and distance will be your y variable.  Make sure you use data labels to label the x and y coordinates of each point.  Print out your graph.
 (An example may look something like this)
  • Using your graph, calculate the slope between each point.  Slope = (y2-y1)/(x2-x1)
  •  Compare the velocities in table 3 with the slopes in table 4.  How are they related?
They should be the same.

  • Convert the average velocity from analysis problem 1 and your fastest velocity from table 3 into miles per hour.
 
Conclusion:
Summarize the lab as well as discuss the relationship between time, distance, velocity, and slope, as well as the process of how we discovered that relationship.

Notes

  •  When I set up the track, I find a slope to put it on and then try to vary the steepness using boxes boards, etc.
  • The accuracy of the stopwatches is questionable at best, but it is a cheap accessible method and since the success of this lab is not determined by the accuracy of the velocities, but by the ability to calculate the velocity and analyze the data it is a good method.   If you don't have stopwatches, most phones and tablets have them.  You can also find stopwatches online like this one.  
  • For this lab the way it is written, experience with Excel is important.  If you do not have Excel or some other graphing program that the students are familiar with, they could actually just graph the data by hand with graph paper. It's really just a few points.  The nice thing about the graph is that it visually represents the velocities.  Once the students discover that the slope of the lines and the velocities are the same numerically, we then talk about how the steepness of the line visually relates to the velocity of the car.  The steeper the line, the faster the car was going. 
  • If the students don't have the math background or ability to calculate the slope, then you don't have to have them do it.  You can just have them graph the data and talk about how the steepness of the line relates to the velocity.  
  • The last question under the analysis has them do some conversions.  This is something that we have previously covered in class and I want them to practice.  The students also like finding this answer as they usually have no idea if the velocity they calculated in ft/s is "fast" or not.  Another discussion that this question usually leads into is scale speed.  While the velocities of the cars may not be too impressive in miles per hour, when you remember that a Hot Wheels car is 1/64 scale and calculate the scale speed, they velocity is pretty impressive.


Hot Wheels STEM Lesson Plan – Energy

Information and Background

In this lab the students calculate the potential energy of their Hot Wheels car at the top of a track and then calculate the kinetic energy of the car at the bottom of the track.  The students then compare these and discuss why they are not the same in the context of the Law of Conservation of Energy. This lab could be carried out very simply with a straight orange track set-up, but I've chosen a little bit different way to go about it.  In my physics class we not only focus on the science concepts, but I also like to get the students involved in design and engineering.  So for this lab the students design and build a "Roller Coaster Track" that the cars roll down.  It does take extra time that all teachers may not have, but I think the critical thinking and problem solving the students do are worth the time that we spend.  I give the students a few pieces of straight orange track to use, but the rest of the roller coaster track must be made from paper and tape, even the curves.  I love the problem solving and thinking that the students use to figure out how to make the paper do what they want it to do and bend how they want it to bend, and support what they want it to support.  There are other things that may be easier to use, but I like the challenge of building it out of paper.  The things you would need for this lab are paper, tape, Hot Wheels cars, orange track, and a stopwatch.  In recent years I have acquired a photogate to help calculate the velocity of the car at the bottom, but previously just used a stopwatch and a distance.  I'll discuss these options and more in the Notes after presenting the lab.


The Lab

Purpose:
The students will investigate Potential and Kinetic Energy while designing and constructing a paper roller coaster track.

Procedure:
Build a roller coaster out of paper, tape and Hot Wheels track. Use the following design criteria:
  • Each roller coaster must include at least:
    • 3 turns of at least 90 degrees separated by a straight section.
    • 2 uphill sections no shorter than 2 car lengths
  • The car must stay on the track through the whole roller coaster.
  • The roller coaster cannot be touched during the test. 
  • Your coaster must be stable. The track should not move or shake when the car travels along the track.
  • Your coaster should end with a flat section on the ground. (This design aspect is so that we can do some calculations regarding the Conservation of Energy) 
Data:
 Use the photogate to determine the velocity at the bottom of the roller coaster. Record the Velocity.


Analysis:

  • Calculate the Potential Energy (PE) of your car before it starts.

  • Calculate what the Kinetic Energy (KE) of your car should be when it finishes. This is the THEORETICAL KE.

  • Calculate the average velocity from TABLE 1.

  • Using the average velocity, calculate the actual Kinetic Energy of the car when it finishes.

  • The Law of Conservation of Energy says that the kinetic energy (KE) when the car finishes should be equal to the potential energy (PE) before the car starts. Meaning PE = KE. In the actual experiment does PE = KE? Was energy lost or gained?

  • Calculate the percent of energy lost?

  • Where did the energy that was lost go?

  • What could you have done to minimize the amount of energy lost?

Conclusion: 
 Discuss this project and its relationship to potential and kinetic energy. Discuss the law of conservation of energy and how it relates to this project. Make sure you discuss what you did do or could do in the future to minimize the loss of energy in your Roller coaster track.

Notes

  • To calculate the Kinetic Energy of the car at the bottom of the roller coaster track, the students need to know the velocity of the car at the bottom of the roller coaster track.  A low tech solution (which I used in the past) is to put a few feet of track at the bottom for the car to roll on and then time the car for those few feet.  Calculate the velocity of the car by dividing the distance by the time.  I recently acquired a photogate and I am able to get the velocity of the car pretty accurately with that. Another option you could use to get the velocity of the car is the Hot Wheels Speedometer.  The Hot Wheels Speedometer gives you a scale speed in miles per hour so you would need to divide by 64 and convert it to whatever units you were using in your energy calculations.
  • Here are a couple of pictures that I show the students to give them a vision of what can be done with paper.  The roller coasters are for marbles, but it gives them some ideas.

  • The students almost always discuss the loss of energy due to friction, but another big loss of energy that I make students aware of is that due to movement of the roller coaster.  I always point out that if the roller coaster is moving as the car goes down the track then you are losing energy.  It takes energy to move things and if your roller coaster is moving, it took energy to do that and that energy is coming from your car. The more sturdy they can build their roller coaster, the more energy that will be conserved.


Friday, January 22, 2016

Hot Wheels Fantasy Pick'em - Week 4

Here is the line-up for races in week 4 of the Hot Wheels Fantasy Pick'em game. You can join in at anytime, so even if you haven't picked in previous weeks, make your picks and have some fun.

The Cars


Custom '72 Chevy Luv

Great Gatspeed

Cruise Bruiser

Twinduction

The Match-ups


Cruise Bruiser vs. Twinduction
Great Gatspeed vs. Custom '72 Chevy Luv


The picks


Results 


Team Standings can be found by clicking HERE and below. See who is racing and make your predictions for week 5 by clicking HERE.


Saturday, January 16, 2016

Hot Wheels Fantasy Pick'em - Week 3

Here is the line-up for races in week 3 of the Hot Wheels Fantasy Pick'em game. You can join in at anytime, so even if you haven't picked in previous weeks, make your picks and have some fun.

The Cars


'15 Jaguar F-Type Project 7

Chevy Camaro Concept

'41 Willys

Porsche 356A Outlaw

The Match-ups

'15 Jaguar F-Type Project 7 vs. Chevy Camaro Concept
'41 Willys vs. Porsche 356 A Outlaw

The picks


Results


Team Standings can be found by clicking HERE.  See who is racing and make your predictions for week 4 by clicking HERE.

A couple of notes.  First, the Camaro that I tested had a bad wheel.  I tried to find another one but failed to find one on the racks so I had to go with this one.  As I inspected the wheel closer I found that it was rubbing on the body of the car.  As I checked all the wheels I found that the clearance was very small.  I would be interested to see if this wheel rubbing problem is common with this casting or mine was an anomaly.  Regardless, if I were entering a rip 'n' race where I didn't get to test the car first, I probably wouldn't take a chance on the Camaro.

I was also disappointed in the Porsche.  I love this casting, but it is not a fast car.  The problem is the body of the car rubs on the side of the track, which is a shame, because I'd love this car to be fast.

Saturday, January 9, 2016

Hot Wheels Fantasy Pick'em Season 1 - Team Standings

Points are totaled after each week. Points double after each round. In round 1 a correct pick is worth 1 point. In round 2 a correct pick is worth 2 points. In week one, there were two possible picks in round 1 and one possible pick in round 2 for a total of three pick and 4 points. In subsequent weeks, the 3rd/4th place race will also be picked giving a possible of 2 picks for each round and a total of 6 points possible.


Hot Wheels Fantasy Pick'em - Week 2

 Here is the line-up for Week 2. You can join in at anytime, so even if you didn't pick in week 1, make your picks and have some fun.

The Cars

Bullet Proof

High-Roller

'63 Chevy II

'69 Dodge Coronet Superbee

The Match-ups

'69 Dodge Coronet Superbee vs. '63 Chevy II
Hi-Roller vs. Bullet Proof

The Picks


Results


Team Standings can be found by clicking HERE.  See who is racing and make your predictions for week 3 by clicking HERE.

We had a few new people join the fun this week, and a few from last week that didn't make picks this week which made for some shuffling of the team standings. Hi-Roller let a lot of people down. With its long wheel base I thought it would have been a little better racer as well. It is pretty light though. I'd previously seen a Bullet Proof in action so I knew it was pretty fast but was a bit surprised how well the Chevy stayed with it. What are your thoughts?

Popular Posts